
Where are the jobs?
Something to chew on over the next few days:
According to Keynesian economics, all of this government spending over the past few years should have led to an explosion of job growth. After all, since 2008 the US Government has ballooned the debt by an annualized rate of 17.47% or about twice the rate of growth over the previous decade. But the jobs aren’t coming. This first graph shows the rate of employment vs. total working age population:
Table 1: May Total Employment Ratio

Notice that the percentage of working age people now working has dropped and kept dropping like a stone, despite all of that spending. In fact, the last time this few people had jobs was in 1982 – and prior to that, 1956, when farm payrolls were significantly higher than they are now. Now for the second half of the equation, part time employment vs. full time:
Table 2: May Employment Type Ratio
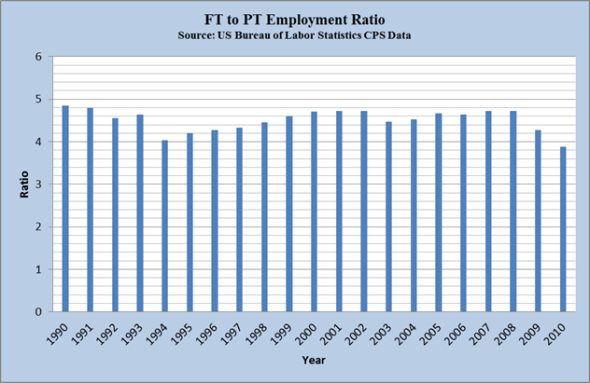
Fulltime employment has also continued to decline. Of course when you realize most of this recovery job “gains have been in retail or service industries, that shouldn’t come as a surprise. Still, the ratio now has dropped below4 FT employees per PT employee, territory we’ve never seen before. You can’t sustain a recovery on the back of McJobs. Right now, if you run the numbers, only 47% of working age Americans have a full-time job. If you’re shocked, you should be. The last time the number fell below 50% was in 1933.
If Barack Obama thinks this is the way towards recovery, he needs a new navigator.

Leave a comment